
WHAT we OFFER
climb higher with data you can trust
Your data should be a strategic asset, not an obstacle.
Turn it into clarity that drives momentum.
Bring order to scattered APIs.
Retire the legacy systems choking your growth.
Build a reporting backbone that’s fast, honest, and able to scale as far as you intend to climb.
How it works
Begin where you are. Climb higher together.
1
on-boarding
We align on your goals, what success looks like, and the scope required to get you there.
2
map the terrain
We review your systems, files, and data flows to chart the clearest, most efficient path forward.
3
climb higher
We handle the heavy lifting; cleaning data, taming messy APIs, and transforming chaos into reliable clarity
4
Plant the flag
You receive polished, ready-to-use deliverables, complete walkthroughs, and ongoing support to keep everything running smoothly.
Clarity
Confidence
Insight
EpiphanyBI turns raw, disorganized data into decision-ready intelligence.
We work with leadership teams to uncover the signal inside the noise — building systems that replace manual reports, eliminate blind spots, and unlock a cleaner, faster path to action.
Whether you need dashboards executives trust, database cleanup that simplifies your entire workflow, or forecasting that finally matches reality, we build reporting foundations that strengthen every decision you make.
Insight-driven, detail-focused solutions
Custom dashboards and reporting, built to fit your goals
Expertise you can count on, with no technical hassle

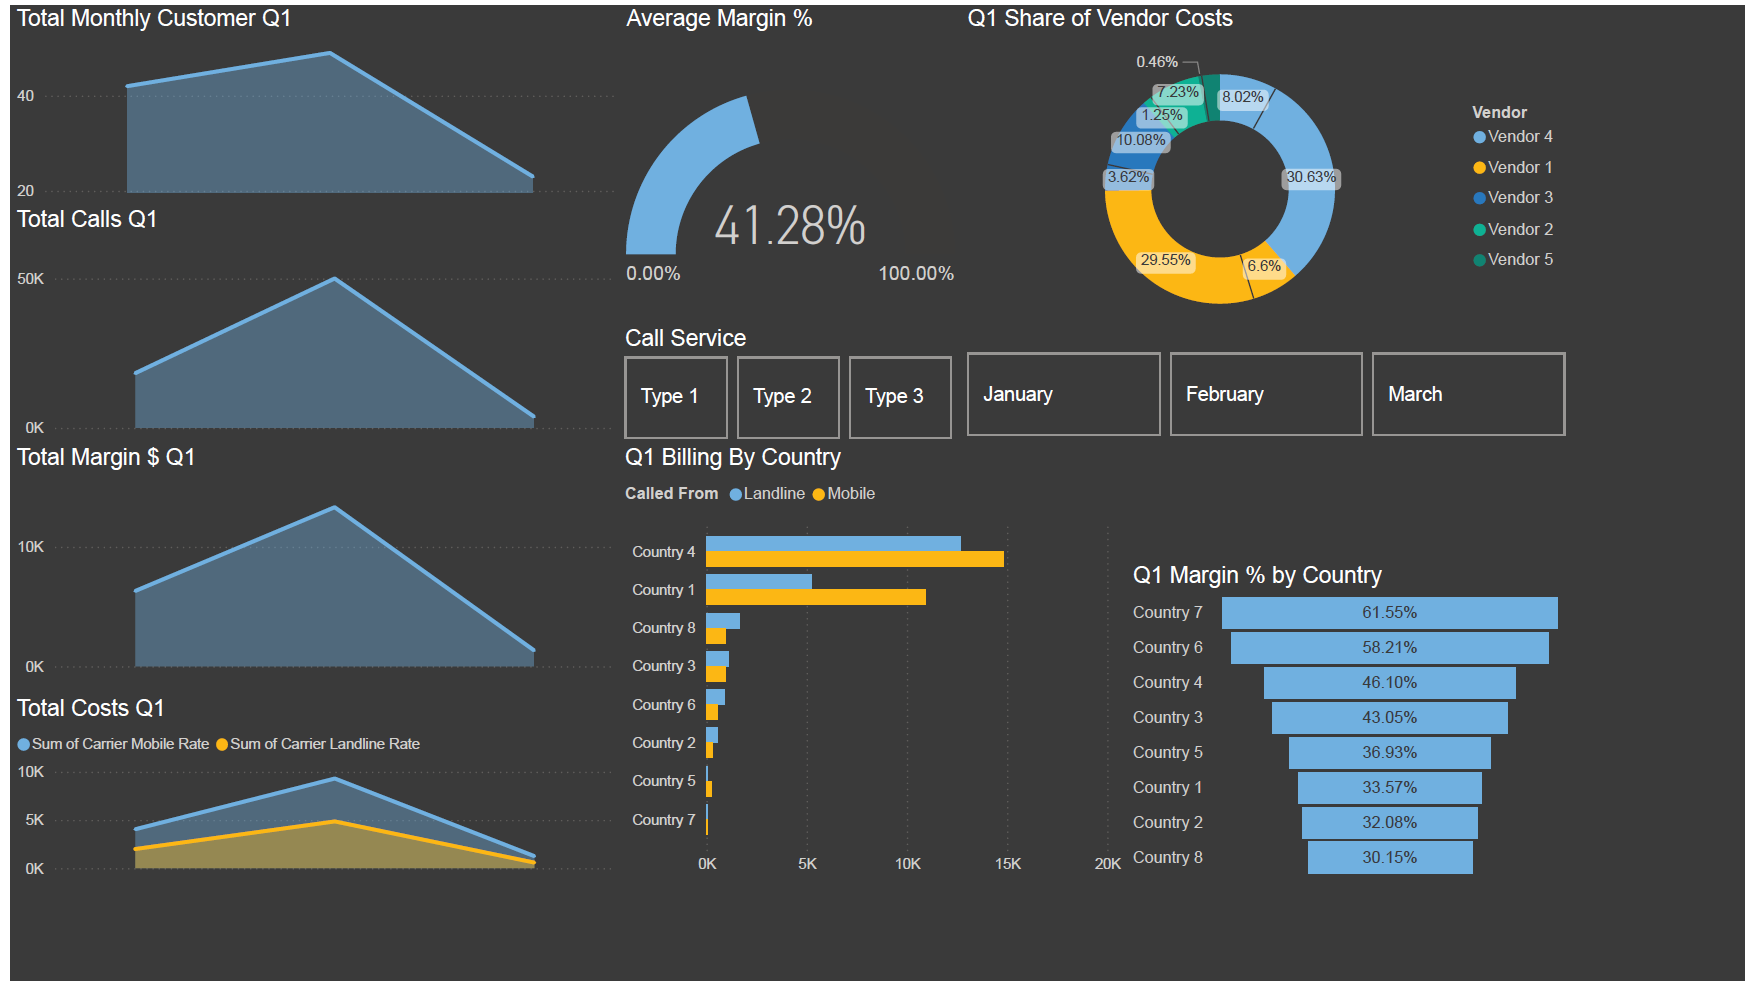
Showcase
Our Latest Projects
(Data anonymized or Public Data Used)
Frequently Asked Questions
How quickly can I expect a response?
We’re committed to responding within 1 business day of your inquiry. Your time is valuable, and we aim to keep communication swift, clear, and efficient from start to finish.
What types of businesses do you work with?
We work with startups, agencies, and enterprise teams across industries—anyone looking to make smarter, faster data-driven decisions.
What tools do you use?
Alongside custom tooling, we primarily use Power BI, Excel, SQL, and other Microsoft tools. We also adapt to your existing stack where possible.
Do I need to have clean or organized data?
Not at all. Part of our process includes cleaning and preparing your data so it’s ready for analysis.
How long does a typical project take?
Most small dashboard builds take 1–2 weeks. More complex data modeling or forecasting projects may take longer… we’ll give you a clear timeline upfront.